
SMM Department
Hospitality

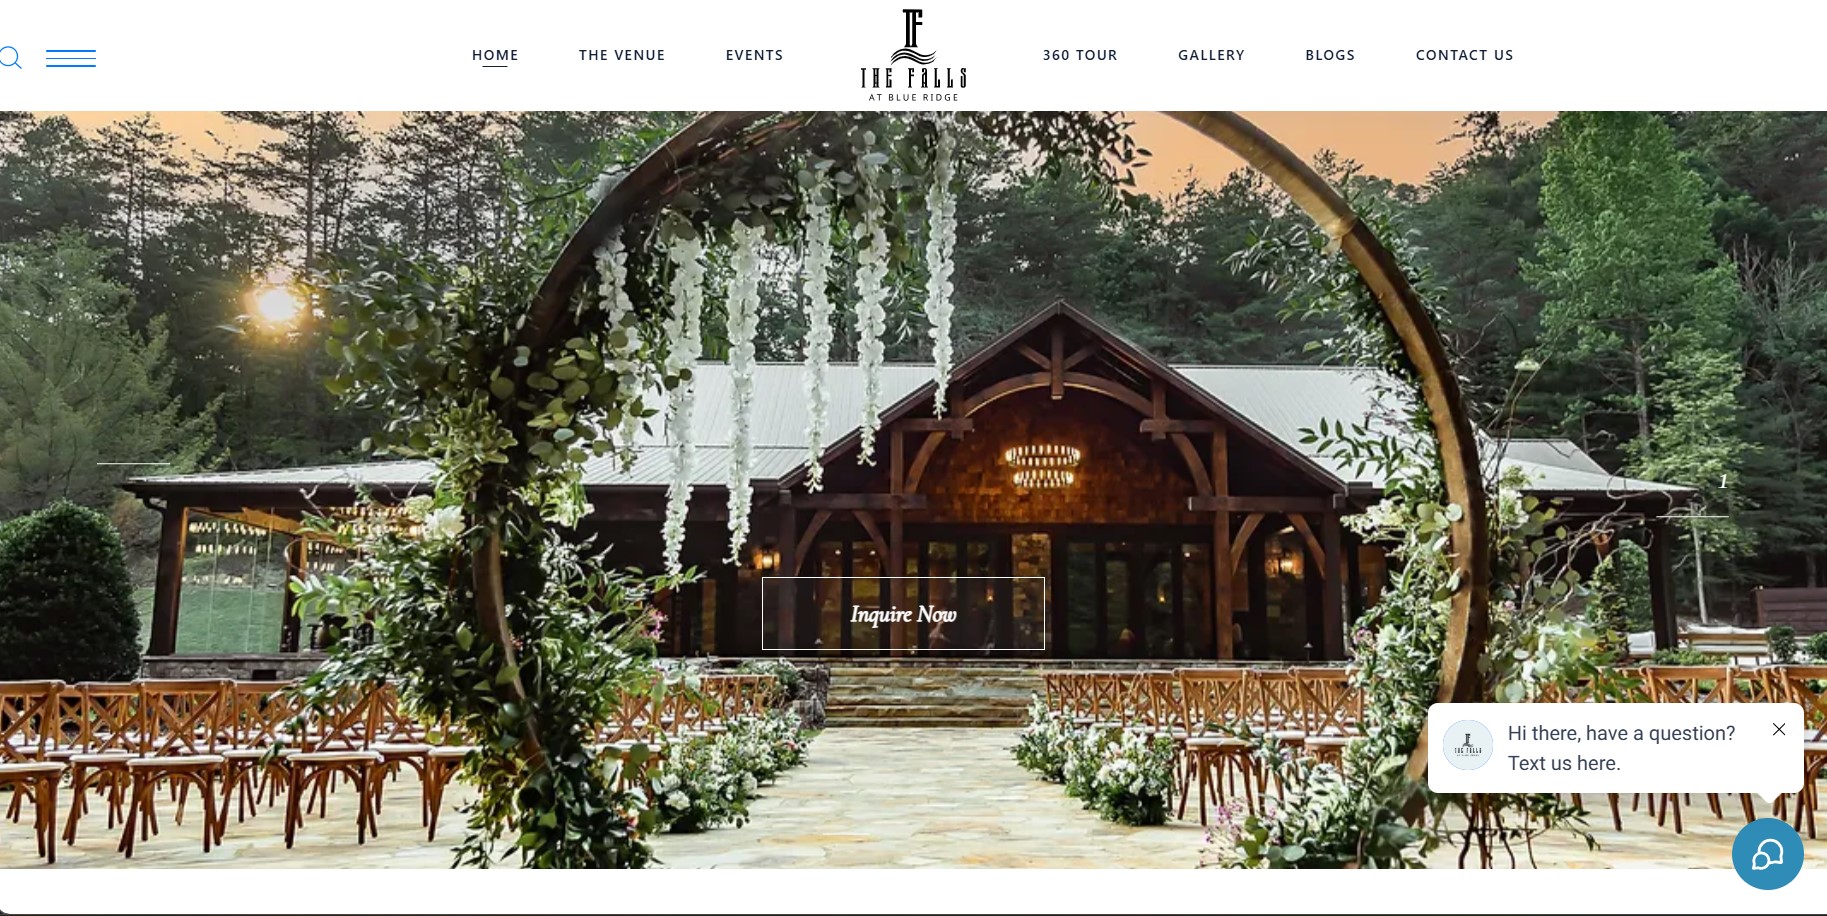
The Falls at Blue Ridge
Engagement: Oct 2025 – Mar 2026 (vs. Apr – Sep 2025)
Type: Reels · Carousel · Static
Goal: Leads
Click to Expand
2,140 leads at $5.99 — and 4× more phone calls.
Cost per lead
$5.99
Verified headline metric over engagement period
Total Spend
$12,824
(was $21,469)
Monthly Budget
$2,100 / mo
Traffic & Channel Performance Metrics
Before vs. After ComparisonReach
288,119
From 461,274
Impressions
970,553
From 1.73M
Link Clicks
23,698
From 31,676
CTR
6.94%
From 4.69%
+48%
CPC
$0.54
From $0.68
−21%
CPM
$7.73
From $10.20
−24%
Conversions, Revenue & Commercial Impact
Leads
2,140
From 2,440
Cost / Lead
$5.99
From $8.80
−32%
Phone Calls
83
From 20
+315%
Call Conv. Rate
0.35%
From 0.06%
+455%
Top Performing Creative Hook
“Sunday brunch + IG-post ads”
Winning Audience Targeting
Interest + demo targeting · website visitor retargeting
Strategic Optimisations Executed
- Interest + open Advantage+ targeting for discovery, layered with demo segmentation for luxury vs mass.
- Strong MOF retargeting (visitors + social engagers) to nurture warm intent.
- Reused authentic top-performing IG posts as ads to keep the brand voice intact.
- Lookalikes built on lead-form fillers to scale high-quality prospects.
Key Wins & Business Impact
- CPL down 32% and CTR up 48% while spend dropped 40%.
- Phone calls grew 4× (20 → 83) — a fundamentally better-qualified lead.
- Lookalike + Advantage+ creative kept performance scaling efficiently.
Verified In-Platform Proof Screenshots (Click to Expand)
Dashboard Proof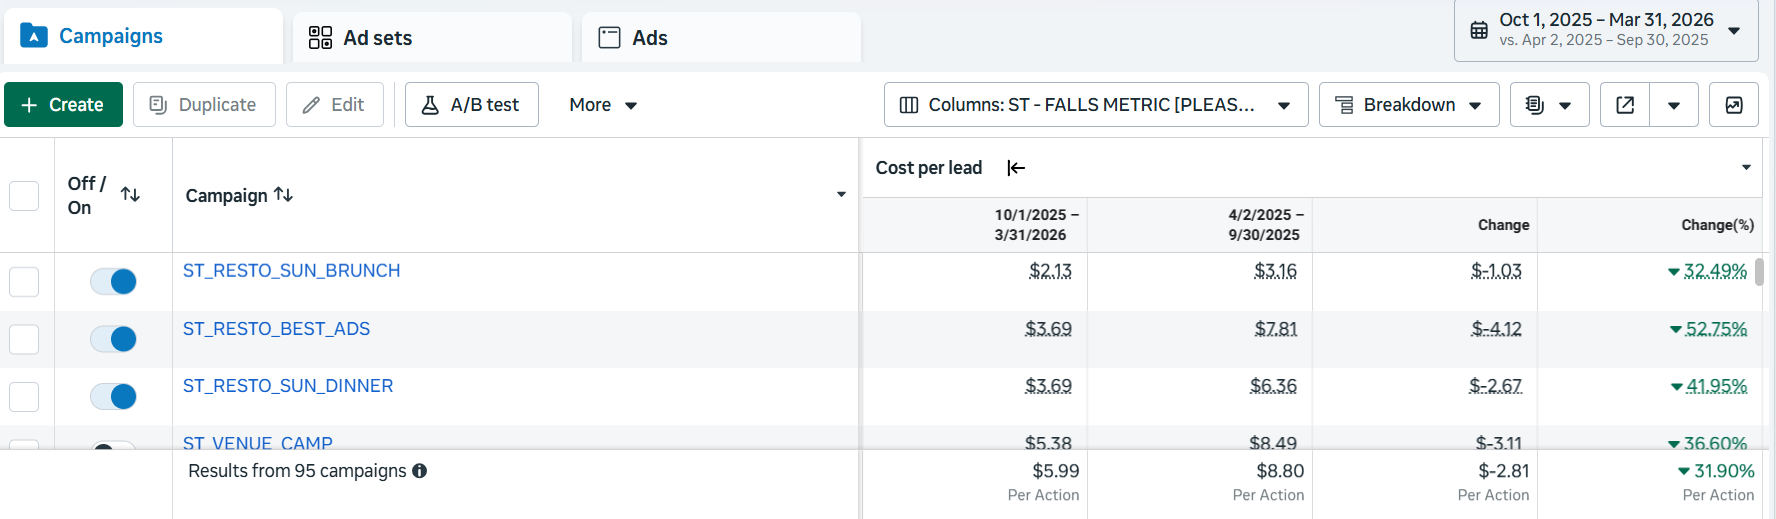
View Full Size
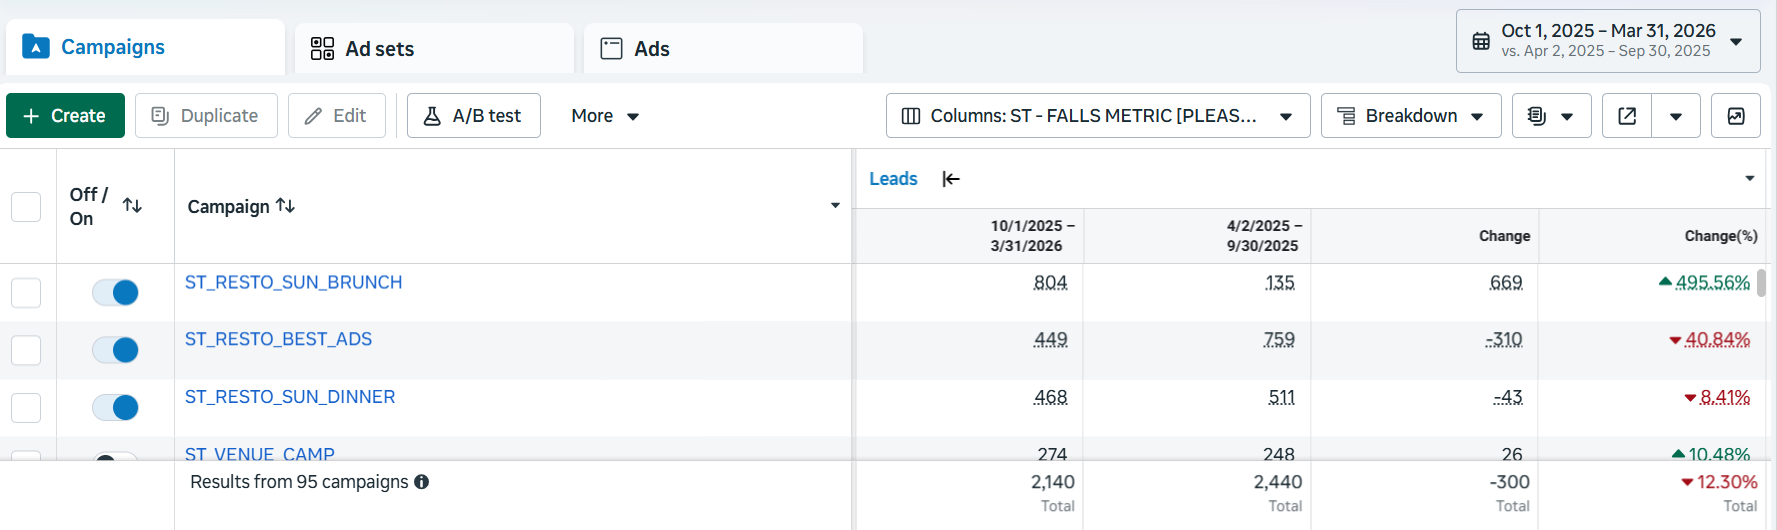
View Full Size
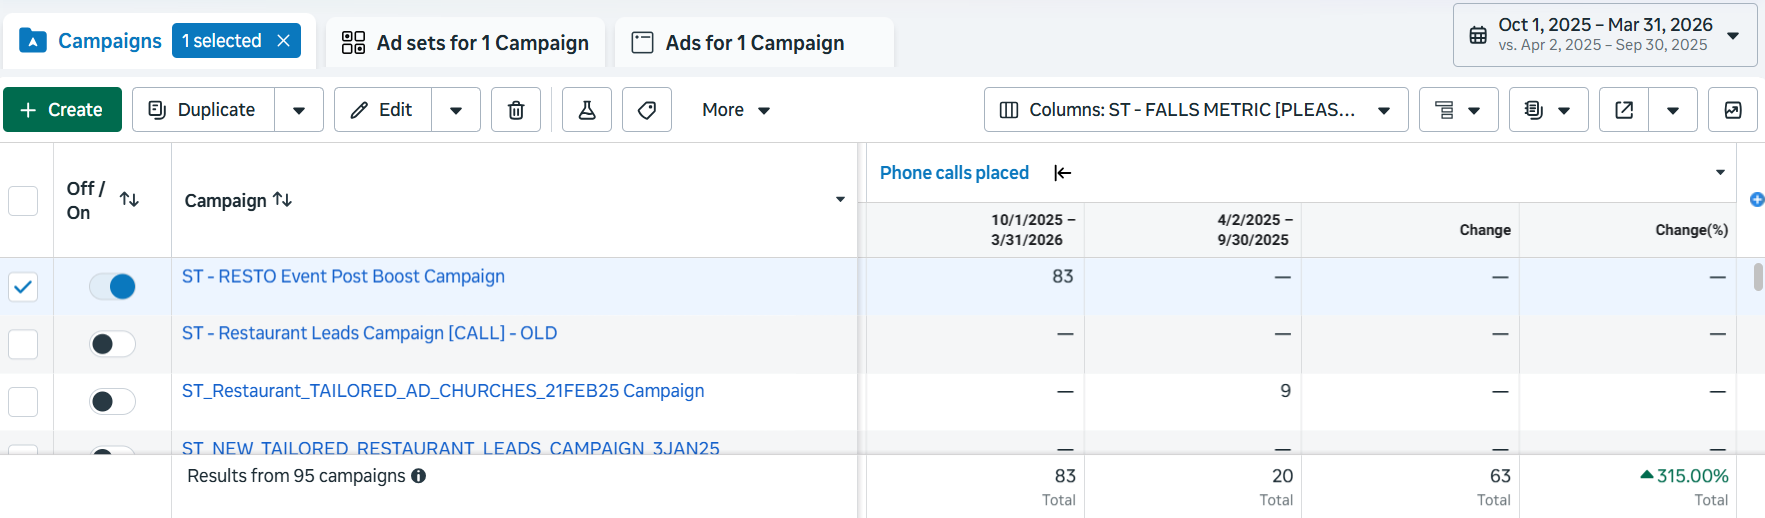
View Full Size
Want similar results for your business?
Book a complimentary strategic growth audit with our senior directors. We'll audit your search, ads, or social funnels and highlight immediate opportunities.